This dashboard is a visual presentation of Energy Garden’s activities. Activities are grouped into the categories of social, environment and finance, with another section called SROI (social return on investment) which shows how much social and environmental benefit is created by Energy Garden.
This dashboard also demonstrates how our work contributes to the United Nations Sustainable Development Goals, which are a group of internationally agreed upon targets that will help society become more equal, safe and sustainable.

 ENERGY GARDEN METRICS


Communities worked with and co-produced with across lifecycle of all Energy Garden stations and projects.
This includes citizens groups, non-profit organisations and local authority-based groups.

Total investment in Energy Garden.


The total amount of funds that have been raised by Energy to set up and/or manage Energy Gardens in countries categorised as emerging by the UN.
Converted from USD to GBP using Morningstar Currency, on 02/07/21.


The percentage of volunteers and youth trainees who expressed an increase in their knowledge or awareness of the environment and/or sustainability since engaging with Energy Garden as a volunteer or youth trainee.


The amount of school workshops, activities or educational sessions held at schools and educational institutions.


The percentage of youth trainees who expressed a positive benefit in their attitude or confidence in improving their career or further education prospects since undertaking the Energy Garden youth trainee programme.


The percentage of self-identified women among the youth trainees across past and present inductees, as an average.


Percentage of Energy Garden youth trainees identifying themselves as being from BAME communities.


Total number of sessions/classes provided to youth trainees. Classes include energy and renewable energy science and application, practical uses and construction of solar, energy efficiency and community distribution, waste and resource use, sustainability, climate and emissions.


Total number of sessions/classes provided to youth trainees. Classes include employment market scoping, community organisation, energy market and finance, and CV and employability sessions.

Total cumulative hours of education sessions / classes provided to youth trainees by Energy Garden.


The total cumulative number of youths who have completed the Energy Garden AQA-certified training programme.

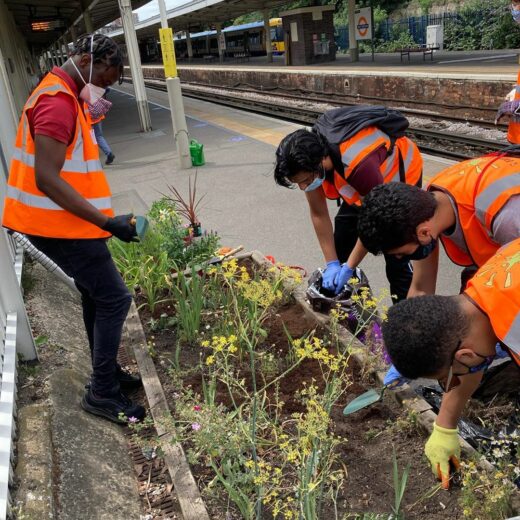
Total hours of physical activity in the current year, which includes light and heavier exercise gardening, repairing, watering, digging, installing structures and errands.
Figure derived by multiplying the total activity hours by number of active volunteers. Rounded to nearest whole number.


The number of collaborations, agreements or space-sharing instigated with local, community, or special interest groups.


Origination of each Energy Garden follows a 6-step process which includes extension consultation with local communities about the potential, space, size, format and constitution of the Energy Garden in prospect.


Energy garden develops solar projects, as well as broadening the geographic location of its operations in countries defined as emerging economies by the UN, where its values strongly benefit communities.

Energy Garden has collaborated and/or provided access to MSc and BSc/BA students interested in sustainability, community engagement and other relevant topics, to undertake research and generate improvements in these areas.
This is a cumulative figure.

This is the total amount of volunteers who are engaged on a regular basis, and derive benefits from Energy Garden. Active volunteers are recorded as the number of volunteers at each station who participate at least once a month.
The monthly total figures are averaged to produce a to-date or yearly estimate of active volunteers. This method was chosen to enable the recording of a figure that best represents the true number of volunteers over time. This figure will be re-calibrated every year, wherein the previous year’s total no longer factors into the average, and counting of monthly totals begins again in January.
